Does competition between municipalities result in lower taxes?
March, 2016
Some academics state that multiple municipalities in close proximity compete to keep taxes down. However, a comparison of local municipalities with others elsewhere in the Province contradicts this assertion.
General Municipal Property Tax Increases – 2002 through 2015
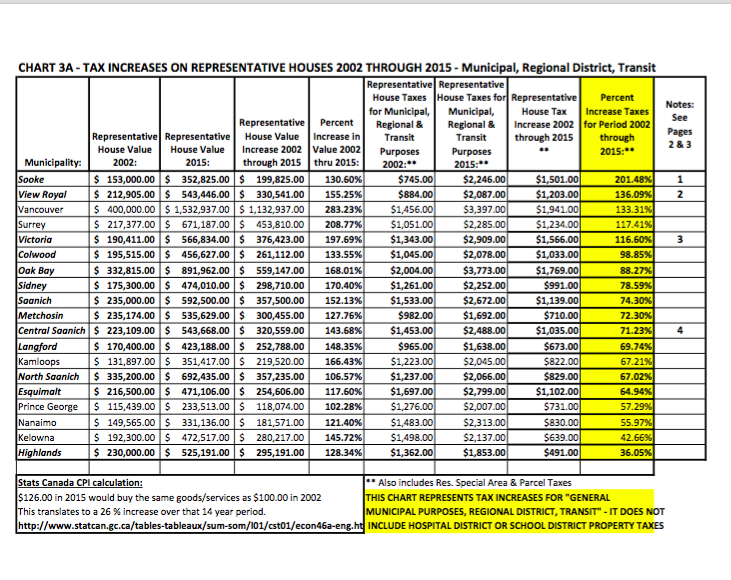
The data below was obtained from the Ministry of Community, Sport and Cultural Development - Schedule 704 – Taxes and Charges on a Representative House. The figures are for property taxes for “General Municipal Purposes Only” – taxes collected for Regional, Hospital & School Districts and for Transit are not included. General Municipal Taxes are the only property taxes that are under the direct and total control of Municipal Councils. The Ministry publishes this data annually for every municipality in the Province – it is available at: http://www.cscd.gov.bc.ca/lgd/infra/tax_rates/tax_rates2015.htm
A representative house value (average house) is calculated by dividing the total general municipal assessment value for land and improvements for all single-family residential subclass of properties into the number of such properties. This value is close to the ‘average value’ used by municipal authorities to inform the public how much taxes on an “average house” will increase in any particular year.
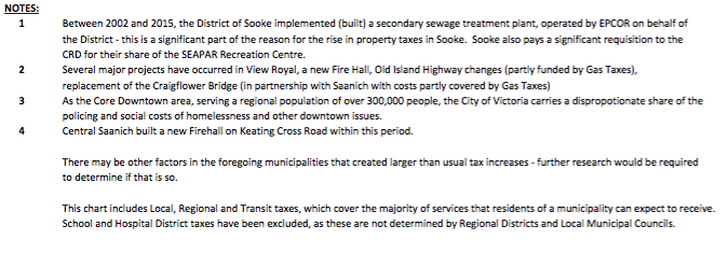
There are reasons why taxes in some municipalities increase by an exceptional amount and some of these can be identified. For instance, Sooke implemented secondary sewage treatment during this period (with no involvement from the CRD). Alternatively, sewage treatment costs for the Peninsula municipalities were incurred through the CRD, hence are not reflected in their Peninsula municipal property tax bills. Central Saanich and View Royal recently built large new fire halls, which may account for increases in those two municipalities. A mitigating factor for tax increases is the growing housing market (more new houses, with street, sewage and water infrastructure provided by developers) that can ease tax increases for all residential taxpayers. Municipalities are required to provide this data to the Province annually. They are a reliable means of tracking trends of municipal (and other) property taxes. The property tax figures provided by the Province are for capital and operating costs in 2002 - 2015. During the same period, Statistics Canada reported that, for Greater Victoria, the Consumer Price Index increased 18.6 % . In 2015, $118.60 was required to buy the same “basket of consumer goods and services” that $100.00 bought in 2002. User fees (garbage, water, sewer, storm sewer utility) are not included, as they are not linked directly to the assessed value of property and user fees can vary based on consumption.
Stats Canada data can be found at: http://www.statcan.gc.ca/tables-tableaux/sum-som/l01/cst01/econ45a-eng.htm
Of interest on this chart are the comparative tax increases of Kamloops (67%), Kelowna (43%), Nanaimo (56%) and Prince George (57%). Central Saanich increased 71%, Colwood 99%, North Saanich 67%, Oak Bay 88%, Saanich 74%, Sidney 79%, Sooke 201%, Victoria 117%, Langford 70%, Mechosin 72%, and View Royal 136%. All substantially more than the four municipalities (above) that are not in close proximity to other municipalities.
- Colin Nielsen
March, 2016
Some academics state that multiple municipalities in close proximity compete to keep taxes down. However, a comparison of local municipalities with others elsewhere in the Province contradicts this assertion.
General Municipal Property Tax Increases – 2002 through 2015
The data below was obtained from the Ministry of Community, Sport and Cultural Development - Schedule 704 – Taxes and Charges on a Representative House. The figures are for property taxes for “General Municipal Purposes Only” – taxes collected for Regional, Hospital & School Districts and for Transit are not included. General Municipal Taxes are the only property taxes that are under the direct and total control of Municipal Councils. The Ministry publishes this data annually for every municipality in the Province – it is available at: http://www.cscd.gov.bc.ca/lgd/infra/tax_rates/tax_rates2015.htm
A representative house value (average house) is calculated by dividing the total general municipal assessment value for land and improvements for all single-family residential subclass of properties into the number of such properties. This value is close to the ‘average value’ used by municipal authorities to inform the public how much taxes on an “average house” will increase in any particular year.
There are reasons why taxes in some municipalities increase by an exceptional amount and some of these can be identified. For instance, Sooke implemented secondary sewage treatment during this period (with no involvement from the CRD). Alternatively, sewage treatment costs for the Peninsula municipalities were incurred through the CRD, hence are not reflected in their Peninsula municipal property tax bills. Central Saanich and View Royal recently built large new fire halls, which may account for increases in those two municipalities. A mitigating factor for tax increases is the growing housing market (more new houses, with street, sewage and water infrastructure provided by developers) that can ease tax increases for all residential taxpayers. Municipalities are required to provide this data to the Province annually. They are a reliable means of tracking trends of municipal (and other) property taxes. The property tax figures provided by the Province are for capital and operating costs in 2002 - 2015. During the same period, Statistics Canada reported that, for Greater Victoria, the Consumer Price Index increased 18.6 % . In 2015, $118.60 was required to buy the same “basket of consumer goods and services” that $100.00 bought in 2002. User fees (garbage, water, sewer, storm sewer utility) are not included, as they are not linked directly to the assessed value of property and user fees can vary based on consumption.
Stats Canada data can be found at: http://www.statcan.gc.ca/tables-tableaux/sum-som/l01/cst01/econ45a-eng.htm
Of interest on this chart are the comparative tax increases of Kamloops (67%), Kelowna (43%), Nanaimo (56%) and Prince George (57%). Central Saanich increased 71%, Colwood 99%, North Saanich 67%, Oak Bay 88%, Saanich 74%, Sidney 79%, Sooke 201%, Victoria 117%, Langford 70%, Mechosin 72%, and View Royal 136%. All substantially more than the four municipalities (above) that are not in close proximity to other municipalities.
- Colin Nielsen